Overlap & Coverage
Front Overlap Vs Side Overlap
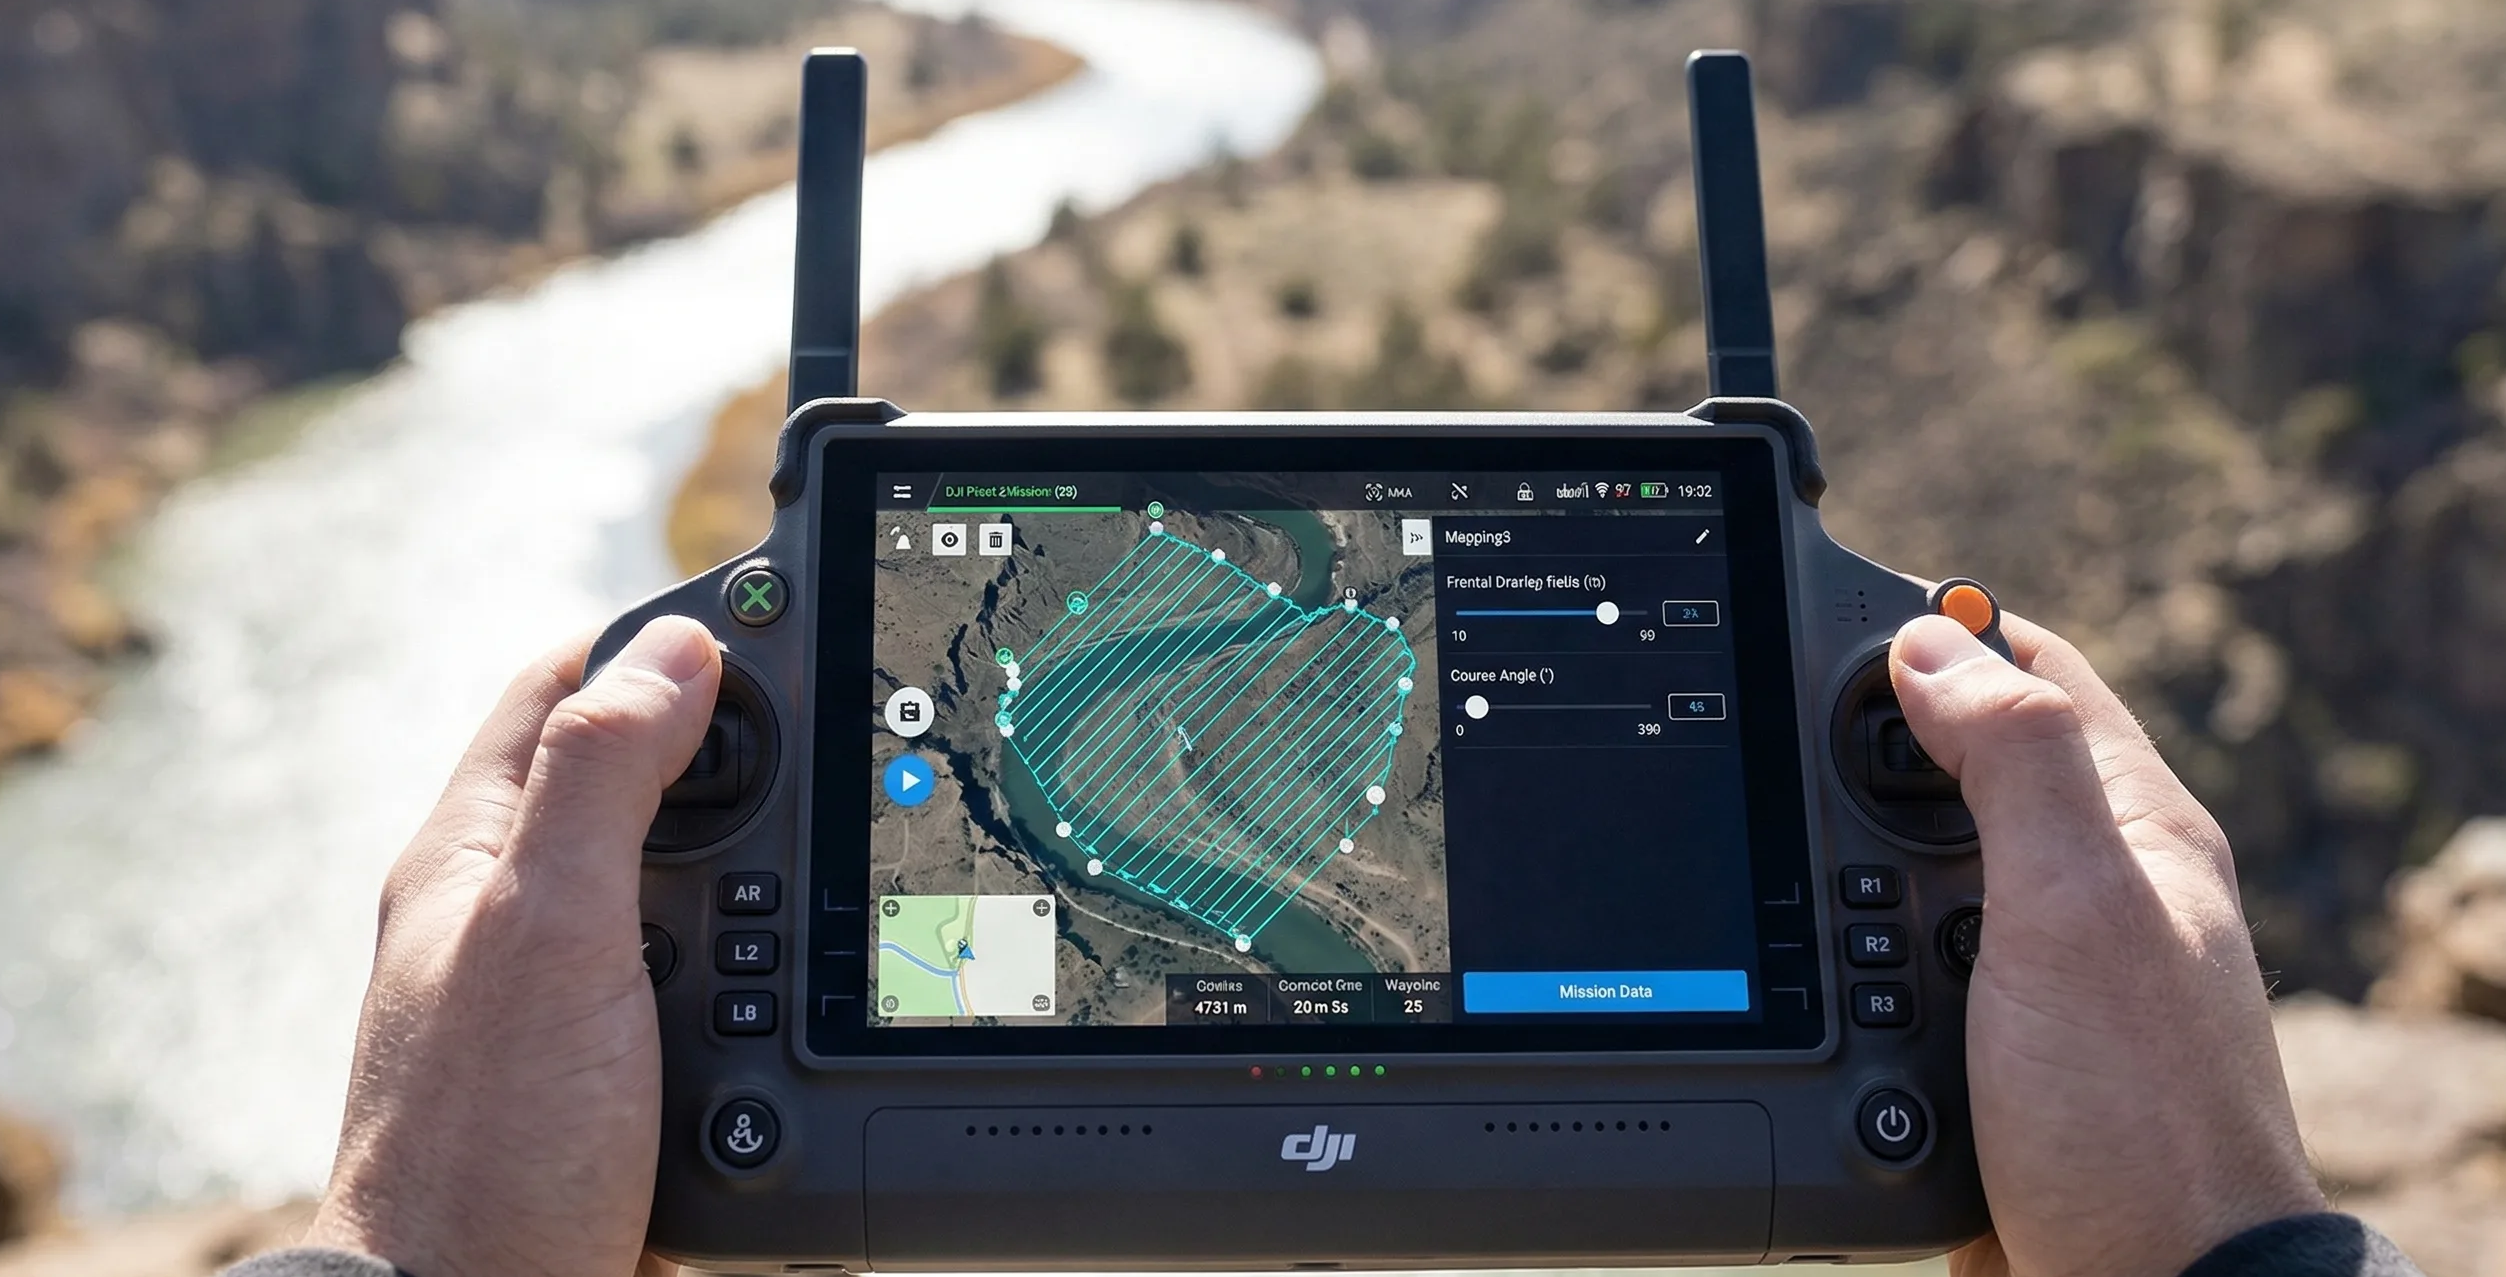
Front overlap and side overlap solve different reconstruction problems. Learn how each one affects alignment stability, strip count, storage growth, and failure risk over low-texture, reflective, or moving surfaces.

Key Takeaways
- Front overlap controls redundancy along the direction of flight, while side overlap controls how adjacent strips stitch together across the block.
- Higher overlap improves reconstruction resilience, but it raises capture density, battery consumption, storage needs, and processing time.
- Good overlap planning is scene-specific: forest canopy, reflective surfaces, and low-texture terrain need more margin than flat, well-textured ground.
Overlap Is A Redundancy Budget
Photogrammetry succeeds by finding the same real-world features in multiple images and solving for their geometry repeatedly. Overlap is the budget that makes that redundancy possible.
More overlap generally raises the odds of a robust reconstruction, but it also costs more time, more photos, and more compute. Professional planning is about assigning that redundancy where risk is high, not pushing every mission to the same aggressive preset.
What Front Overlap Changes
Front overlap is the repeated coverage from one frame to the next along a single strip. It determines how consistently the photogrammetry engine can match the scene while the aircraft is moving forward.
Lower front overlap means fewer shared tie points between consecutive frames. That makes alignment less tolerant of shifting shadows, wind-driven vegetation, repetitive textures, or subtle changes in exposure between captures.
Because front overlap mainly changes trigger spacing, it has its strongest effect on photos per strip rather than the number of strips themselves.
Trigger Intervals And Storage Bottlenecks
High front overlap becomes a hardware problem long before it becomes a software problem. On a low-altitude mission, pushing front overlap into the mid-80s or 90s can drive trigger intervals below one second.
That is where storage throughput and shutter timing start to matter. If the card cannot keep up, frames drop, the computed overlap is broken in practice, and the mission gains a hole that no amount of later processing can fully repair.
- Short capture intervals demand fast media and a camera buffer that can clear predictably.
Flight Memory
SanDisk Extreme PRO 256GB
The enterprise standard MicroSD. Sustains 140MB/s write speeds to completely eliminate dropped frames during 0.7s interval grid mapping.
- Dropped frames are not a minor nuisance; they break the overlap matrix you planned around.
- High front overlap should be validated against aircraft speed, altitude, and capture hardware together.
What Side Overlap Changes
Side overlap is the repeated coverage between neighboring strips. It determines how well the survey block ties together laterally instead of just within one flight line.
This is why side overlap has such a direct relationship with strip count. Raise the percentage and the distance between lines shrinks. On larger sites that can add flight lines quickly, especially when the area is irregular or the camera footprint is already small.
- Front overlap changes photo spacing inside a strip.
- Side overlap changes the gap between strips and therefore the strip count directly.
- Both settings improve redundancy, but they stress the mission in different ways.
The Exponential Cost Of Data Bloat
Overlap percentages can look harmless in an input field, but the effect scales with project size. A change from 65% to 75% side overlap across a large job can mean extra batteries, extra turns, and a much larger field backup requirement.
Continuous Field Power
Anker SOLIX C1000 Power Station
1056Wh LiFePO4 chemistry built for the survey truck. Run a continuous charging loop for DJI enterprise batteries and eliminate the need for $1,500 in spare packs.
The challenge is not limited to storage volume. More overlap means more image review, more transfer time, and more downstream depth maps and intermediate products. The cost compounds well beyond the aircraft flight time alone.

Field Example: Dense Vegetation Vs Blacktop
Imagine a 100-acre mission that includes dense pine canopy and a recently asphalted logistics yard captured with a Matrice 350 RTK and P1 payload. A one-size-fits-all 75/75 setting is almost guaranteed to overfit one part of the site and underfit the other.
The blacktop may still align adequately at moderate settings if it contains enough markings, wear, and texture. The tree canopy is the opposite case: branches move, shadows drift, and the visible shape of the surface changes between passes.
- Flat, textured pavement may be workable around 75/70 when the deliverable is straightforward.
- Dense vegetation, weak texture, or reflective surfaces justify stronger overlap such as 85/80 or higher.
- Polygon-by-polygon planning is often better than forcing one overlap ratio across the entire job.
The lesson is simple: overlap should be based on scene risk, not on habit. If the environment is hard, do not plan at the minimum edge of acceptable redundancy.
Operational Protocol: Setting Up Overlap Ratios
Set overlap with the scene, the aircraft, and the processing risk in view.
- Audit the environment for low texture, motion, glare, canopy movement, or discontinuous geometry.
- Estimate the operational cost of stronger overlap in strips, photos, storage, and battery usage before you commit.
- Recalculate overlap whenever altitude, heading, or sensor selection changes.
- Inspect data quality with reconstruction stability in mind, not just whether a 2D mosaic looks visually acceptable.
Use the calculator with this guide
After reading the trade-offs, compare them inside the live calculator so you can see how altitude, overlap, route heading, and camera choice affect the plan on an actual mission footprint.
Related guides
Core Concepts
What Is GSD In Drone Mapping?
Ground sample distance sets the real resolution ceiling for drone mapping. Learn how to calculate it, where low-altitude planning backfires, and how to choose a target that matches the deliverable instead of chasing the smallest possible number.
Mission Planning
How To Plan A Photogrammetry Mission
Plan a mapping mission from the deliverable backward. This guide covers deliverable-first thinking, route geometry, margins, heading choices, corridor examples, and the preflight checks that keep the job physically executable.

Operations & Storage
How To Estimate Flight Time And Storage
Flight time and storage are mission constraints, not afterthoughts. Learn how tighter GSD, stronger overlap, and payload choice compound into more strips, more batteries, and larger backup requirements.